

The market gods smiled on contrarians in April 2025. While retail investors puked up positions in panic, the VIX surged past 60—the highest level since COVID-19 crashed markets in March 2020—and the S&P 500 bottomed at 4,837. Three months later? The index had stormed back to near all-time highs, volatility collapsed, and the crowd that sold at the lows was left scrambling to buy back in at premium prices.
This isn't new. It's the oldest playbook in markets: when everyone else is terrified, you get paid to be brave. The VIX—Wall Street's so-called "fear gauge"—doesn't just measure panic. It creates opportunity.
But here's the thing nobody tells you: trading VIX spikes isn't about being a permabull who blindly catches falling knives. It's about understanding when extreme fear has mathematically overshot reality, when the options market is pricing in Armageddon that probably won't arrive, and when volatility itself becomes a mean-reverting asset you can trade.
Let's talk about how to actually profit from market panic.
The VIX Isn't What You Think It Is
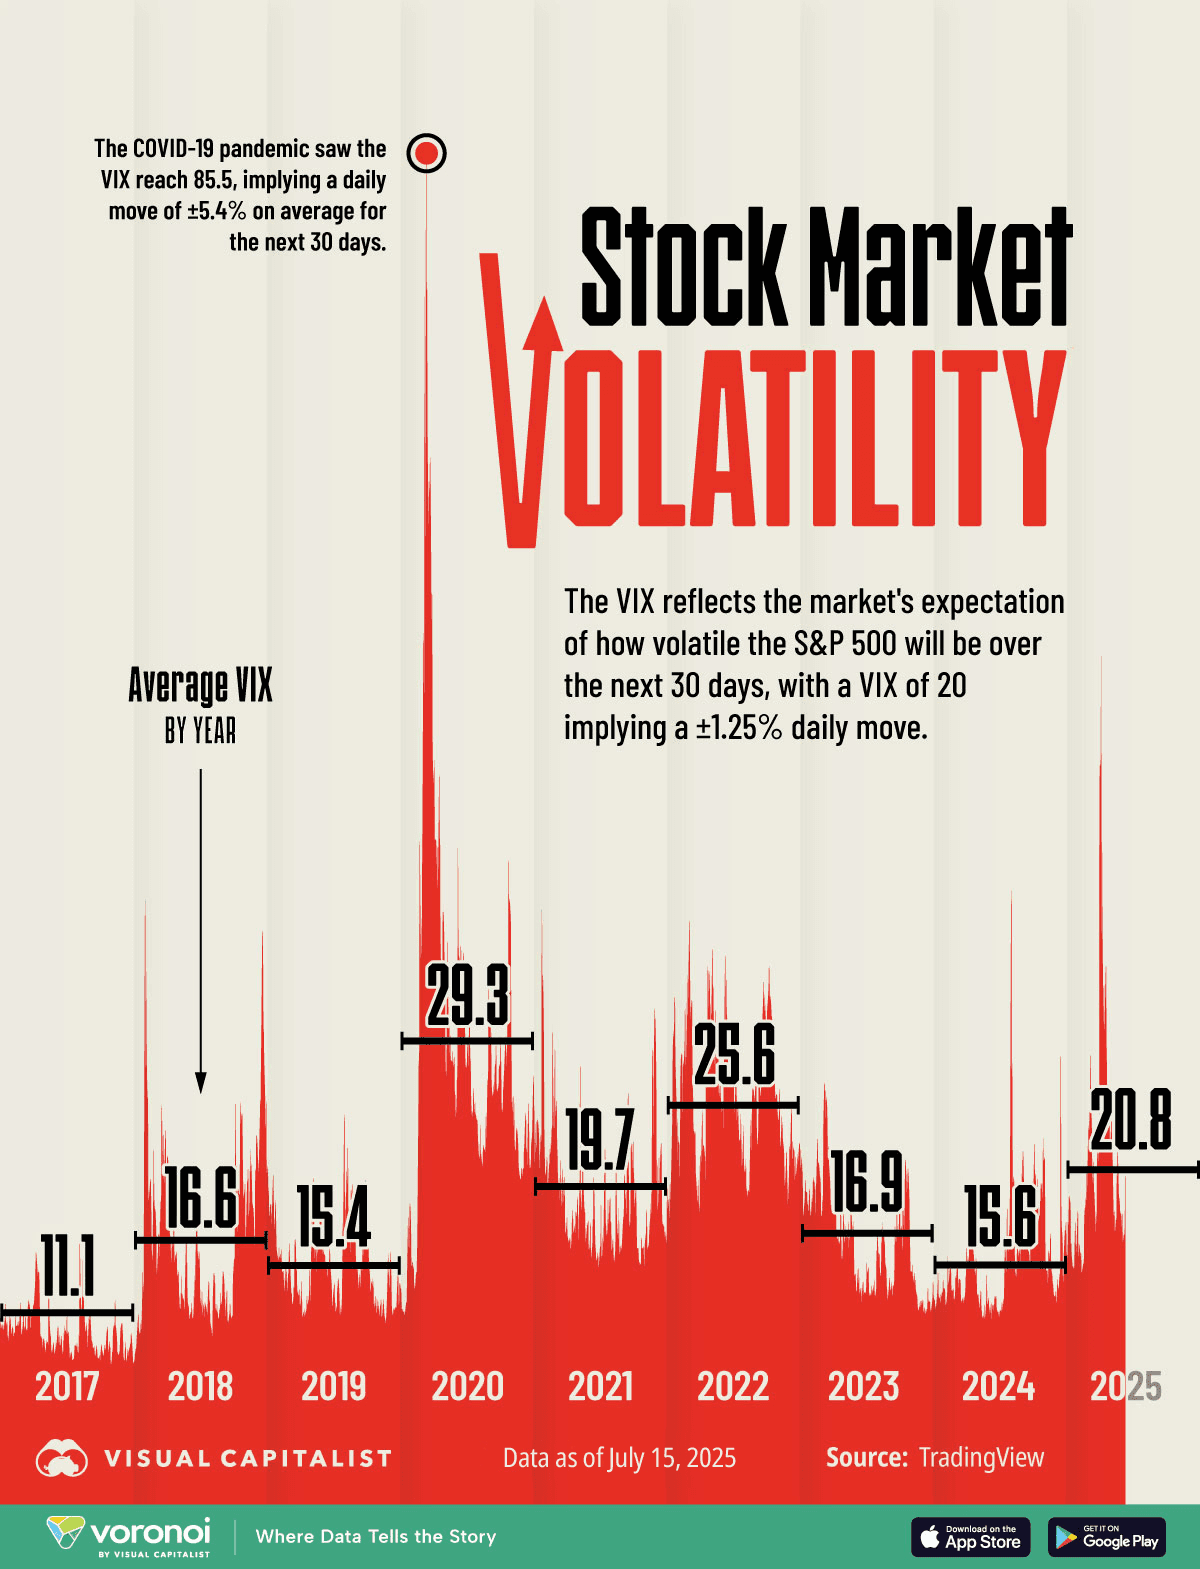
The CBOE Volatility Index measures expected 30-day volatility based on S&P 500 options pricing. When traders pay up for puts—portfolio insurance against a crash—the VIX spikes. When complacency returns, it deflates.
Here's what matters: the VIX is mean-reverting. Unlike stocks that can trend higher for years, volatility gravitates back toward its long-term average around 15-20. This structural feature creates the foundation for contrarian trades.
The problem? Most traders don't understand that the VIX itself isn't directly tradable. You can't buy "VIX shares." What you're actually trading are VIX futures, options on those futures, or ETFs/ETNs that track those derivatives. And these behave very differently from the spot VIX index you see plastered on financial TV.
Case in point: in August 2024, the VIX exploded to 65.73 on recession fears tied to a weak jobs report. The media screamed about impending doom. But professional traders who understood mean reversion bought the panic. Within weeks, the VIX had collapsed back below 20, and those contrarian positions printed money.
Reading VIX Levels Like a Pro
Not all VIX spikes are created equal. Understanding the magnitude tells you how aggressively to position.
VIX 15-20: Normal market conditions. Complacency reigns. This is when you should be cautious about overextended bull runs, not when you're hunting for panic trades.
VIX 20-30: Elevated concern. Markets are nervous, but not broken. April 2025 saw VIX briefly touch the mid-20s on tariff pause rumors before retreating. These moves often represent false alarms—market hiccups, not crisis.
VIX 30-40: Serious stress. Corrections (10%+ drops) typically accompany these readings. When China announced 34% retaliatory tariffs in 2025, the VIX hit 37. This is where you start watching for contrarian setups—but stay patient.
VIX 40-50: Crisis territory. Market panic accelerates. Fed Chair Powell's "challenging scenario" warning about tariffs pushed VIX to 42 in April 2025. Historical data suggests these levels often precede bottoms for long-term investors.
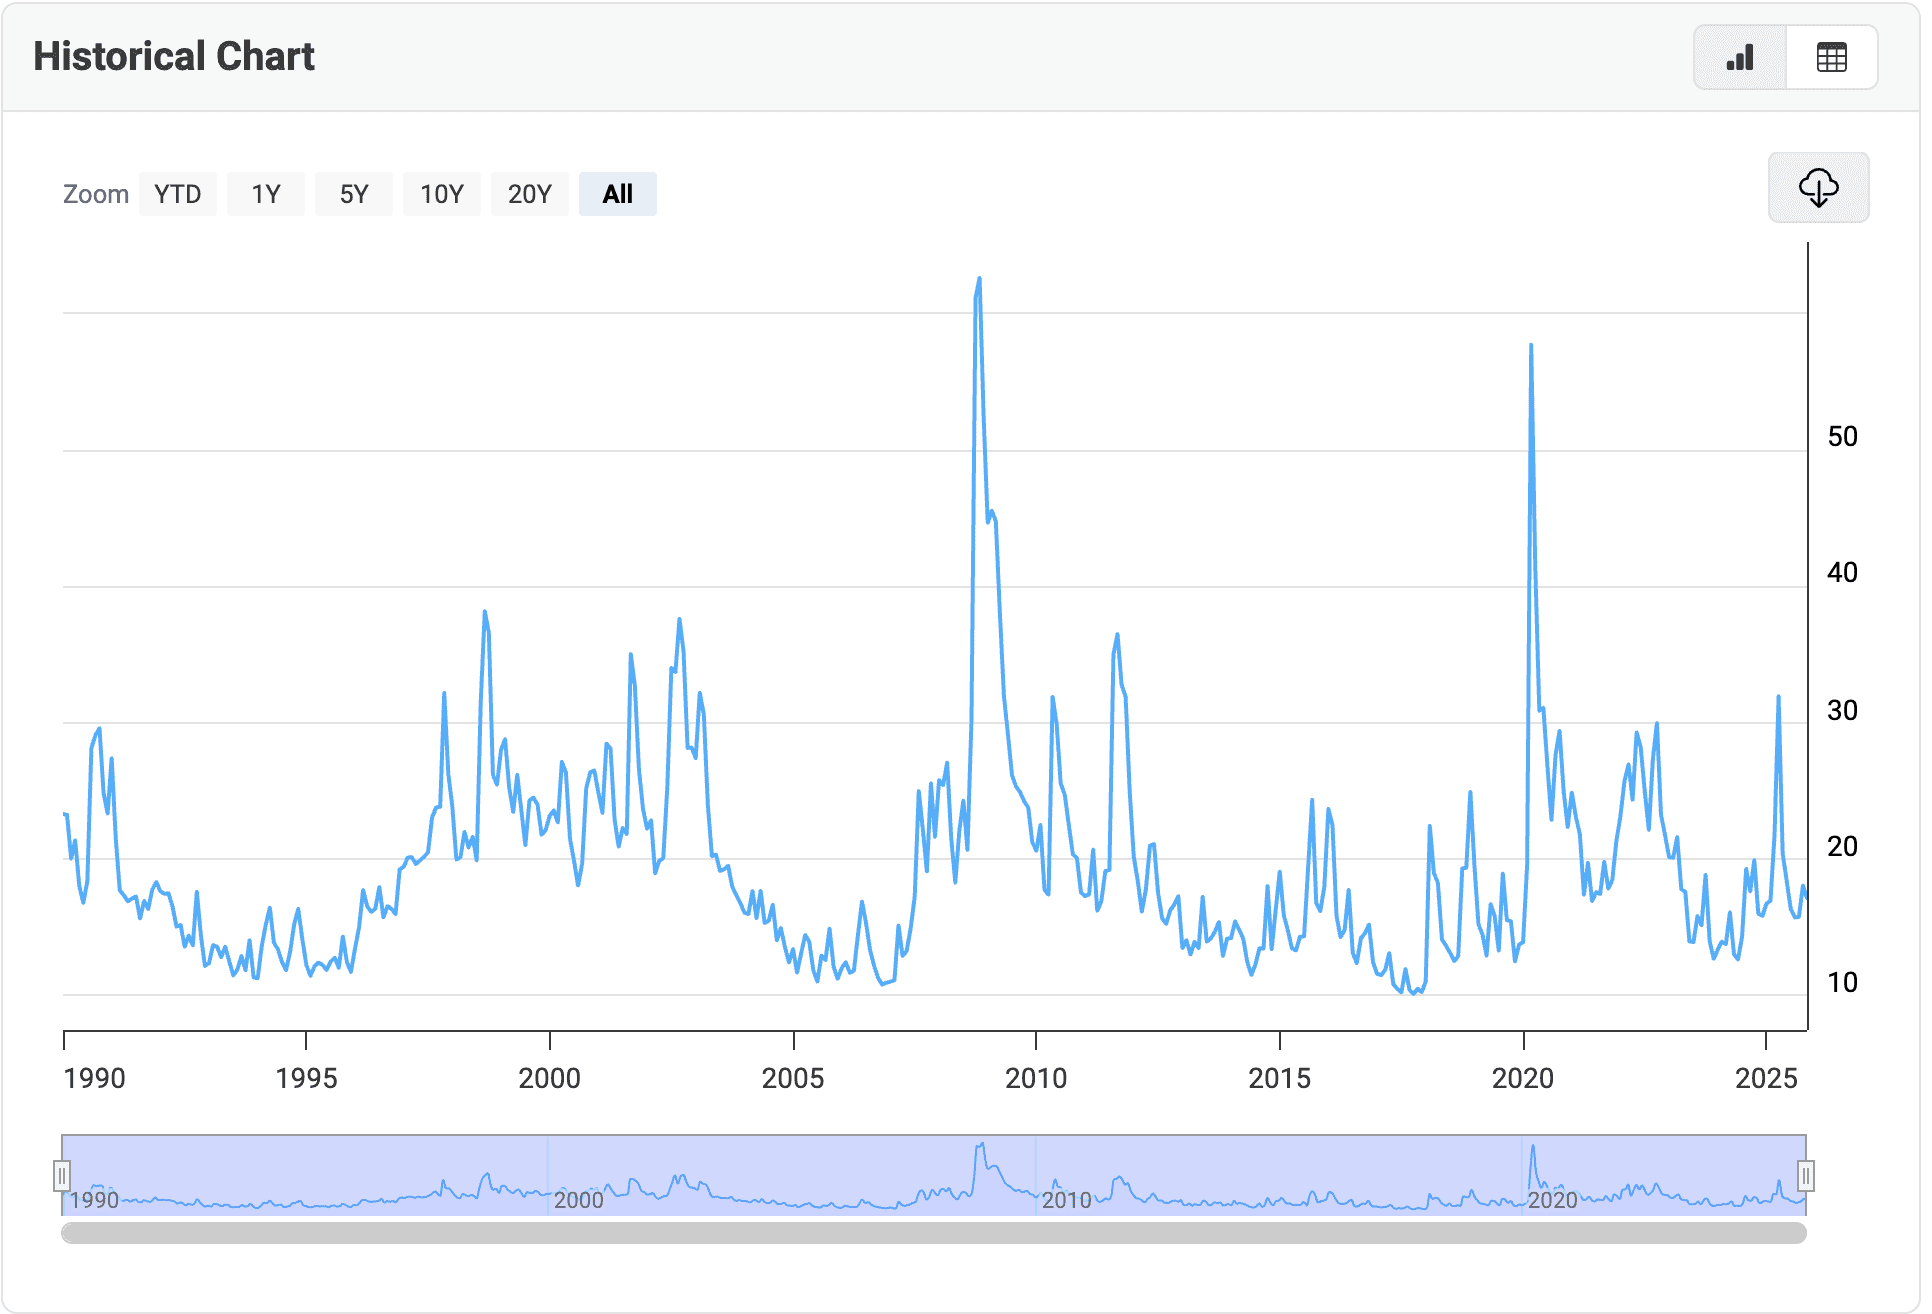
VIX 50+: Capitulation. This is the sweet spot for contrarians. Since 1990, the VIX has breached 50 only three times: October 2008 (hit 80 during the financial crisis), March 2020 (reached 82.69 at COVID panic), and April 2025 (touched 52.33 on tariff fears). Each time marked or was very close to a cyclical market bottom.
The old trader's maxim applies: "When VIX is high, it's time to buy. When VIX is low, it's time to go."
The Mean Reversion Setup: 200-Day Moving Average Strategy
Professional traders don't just watch absolute VIX levels. They watch how far the index deviates from its long-term average.
Trader Nick's 200-day SMA approach provides a systematic framework: plot a 200-day simple moving average on the VIX chart, then look for extreme deviations. When the VIX spikes well above its 200-day average—especially 2x or more—you're typically seeing emotional selling that creates buying opportunities in the underlying S&P 500.
Example: In April 2025, the VIX surged to ~60 while its 200-day SMA sat around 20-22. That 3x deviation from average represented maximum fear. The S&P 500 bottomed at 4,837 on that same spike. From there, volatility collapsed and stocks rallied hard.
The inverse also holds: when VIX falls sharply below its 200-day average, it signals dangerous complacency. Markets sitting at all-time highs with sub-12 VIX readings? That's when you tighten stops and reduce risk exposure, not pile in.
Combine this with the AAII Investor Sentiment Survey, which tracks weekly bullish/bearish sentiment among retail investors. During April 2025's tariff panic, AAII sentiment showed heavy bearish bias—perfectly aligned with the elevated VIX. That sentiment extreme, paired with a stretched VIX reading, created the buy signal.
How to Actually Trade VIX Spikes
You can't buy the spot VIX. So what are your options?
VIX Futures: Direct exposure to volatility expectations. VIX futures let you go long or short based on your view. The catch? Futures typically trade in contango—meaning longer-dated contracts cost more than near-term ones—which creates constant decay for long positions. This makes futures better suited for short-term tactical trades, not long-term holds.
VIX ETFs (Long Volatility): Products like VIXY (ProShares VIX Short-Term Futures ETF) track front-month VIX futures. When volatility spikes, these surge. But contango decay slowly bleeds value over time, so these work best as short-term hedges or panic plays.
UVXY (ProShares Ultra VIX Short-Term Futures ETF) offers 1.5x leveraged exposure to the same futures index. In April 2025, when the VIX hit 52, UVXY provided amplified gains for traders positioned ahead of the spike. But the leverage cuts both ways—when volatility collapses, UVXY gets annihilated. It's designed for tactical trades measured in days or weeks, not months.
Inverse VIX ETFs (Short Volatility): This is where the real money gets made in calm markets. SVXY (ProShares Short VIX Short-Term Futures ETF) provides 0.5x inverse exposure to short-term VIX futures. When volatility falls from extreme levels back toward normal, SVXY grinds higher. After the April 2025 spike, as VIX collapsed from 60+ back to the high teens over subsequent months, inverse volatility products delivered consistent gains.
SVIX (-1x Short VIX Futures ETF) offers full inverse exposure but includes protective call options to limit losses during volatility explosions. This hedging overlay costs money but prevents total wipeout during black swan events.
VIX Options: The sophisticated play. Buying VIX calls when volatility is suppressed gives you convex payoff during market crashes. These options are European-style, cash-settled, and expire on Wednesdays. The key: they're priced off VIX futures, not spot VIX, so understanding the futures curve is critical.
The Contrarian Trade Setup
Here's the actual playbook for profiting when fear spikes:
Step 1: Wait for VIX >40. Don't jump early. The crowd has to be properly terrified. Half-measures don't work.
Step 2: Check the 200-day SMA. Is the VIX at least 2x above its long-term average? If yes, you're in prime territory.
Step 3: Look for VIX futures backwardation. When near-term VIX futures trade higher than longer-dated contracts, it signals extreme short-term fear. This was observed in March 2025 when VIX hit 29—a potential short-term tradable bottom.
Step 4: Buy quality stocks or index ETFs. Not garbage. During April 2025's sell-off, companies like Nvidia got indiscriminately hammered despite strong fundamentals. That's opportunity.
Step 5: Consider tactical long volatility hedges. If you're nervous about timing, buy small positions in UVXY or VIX calls as insurance while building stock positions. If markets crater further, your hedges cushion the blow. If markets recover, you make money on stocks despite losing on the hedge.
Step 6: Scale out as VIX normalizes. When volatility drops back toward 20, start taking profits. Don't be greedy. The trade isn't "stocks go up forever"—it's "fear was overpriced."
The Math Behind Market Bottoms
Historical evidence is overwhelming: within three years of VIX spikes above 40, the S&P 500 not only recovered losses but produced additional positive returns in every case dating back to 1990. Five years out? Those gains continued.
During COVID's March 2020 crash, investors who bought when VIX breached 80 caught one of the strongest bull markets in history. The S&P 500 doubled over the following year.
In the 2008 financial crisis, VIX first spiked above 80 in October 2008. The market briefly rallied, then made another leg down to the final bottom in March 2009. So extreme VIX readings don't guarantee you've hit the absolute bottom—sometimes markets have multiple capitulation events. But they do signal you're in the zone where long-term risk/reward heavily favors buyers.
April 2025 offered another textbook example. Tariff panic drove VIX to 52.33. Media proclaimed economic disaster. Retail investors sold everything. Three months later, VIX had retreated back to the low 20s and the S&P 500 was preparing to break out from its range-bound consolidation.
The Psychological Edge Nobody Talks About
The hardest part isn't the mechanics. It's the psychology.
When VIX hits 50+, CNBC is showing circuit breakers, your portfolio is down double digits, and your spouse is asking if you should "just sell everything," your brain is screaming danger. Every instinct tells you to run.
That's precisely when you should be buying.
Recency bias kills traders. After extended bull markets with low VIX readings, investors forget what real volatility feels like. When it returns, they're shocked and unprepared. This was evident in early 2025—despite clear tariff warnings, many investors remained fully invested, lulled by 2024's calm markets.
Professional contrarians understand that maximum pain = maximum opportunity. VIX >50 historically represents "the sound of the bottom falling out but also the final scream before recovery."
Warren Buffett's maxim isn't just motivational fluff: "Be fearful when others are greedy, and greedy when others are fearful." It's mathematically sound when applied to VIX extremes.
Risk Management: Don't Be Stupid
Contrarian trading isn't gambling. It requires discipline.
Size positions appropriately. Don't go all-in on a single VIX spike. Markets can stay irrational longer than you can stay solvent. Scale in as fear intensifies.
Use stop losses on volatility products. Leveraged VIX ETFs like UVXY can gap against you brutally. Protect yourself.
Understand contango decay. Holding long VIX futures or ETFs costs you money every day markets don't crash. These are tactical weapons, not strategic holdings.
Remember: VIX can spike twice. The 2008 crisis saw multiple VIX explosions above 80 before the final bottom. Don't assume one spike = done.
Inverse volatility products can blow up. February 2018's "Volmageddon" event saw XIV (an inverse volatility ETN) lose 90% of its value in a single day before being liquidated. SVXY survived but was restructured to half its previous leverage. Tail risk is real.
Current Market Context: Where Are We Now?
As of November 2025, VIX sits around 17-19—below its long-term average of 20. Markets are relatively calm, which means we're not currently in prime contrarian territory.
But that's the point. You prepare the playbook during peace so you're ready for war. 2025 has already seen VIX average around 18.75 over 12 months—elevated compared to 2023-2024's sub-17 averages. Tariff uncertainties, geopolitical tensions, and Fed policy shifts keep volatility moderately elevated.
The October 2025 spike saw VIX jump 25.68% in a single day to around 20-21, marking the largest single-day surge in over six months. While nowhere near crisis levels, it reminded traders that volatility can resurface quickly.
Smart money isn't chasing stocks at all-time highs with complacent VIX readings. They're watching, waiting for the next panic—and preparing to buy it.
The beauty of VIX-based contrarian trading is its replicability. This isn't some esoteric strategy that only works in backtests. It's been validated across decades, multiple market crises, and countless iterations.
Markets will panic again. They always do. When VIX next explodes past 40, the crowd will sell. Media will predict doom. Retail will capitulate.
And you? You'll be on the other side of that trade, buying fear at wholesale prices.
NEVER MISS A THING!
Subscribe and get freshly baked articles. Join the community!
Join the newsletter to receive the latest updates in your inbox.


