

The "Duration of Recovery" Myth: Why the Next High Could Take 5 Years, Not 5 Months
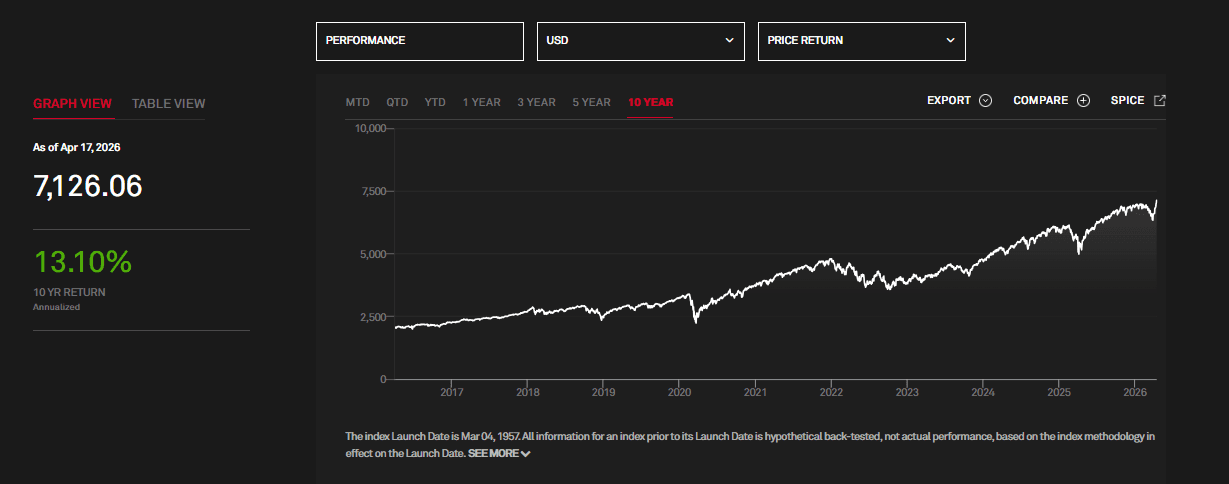
Recently, the S&P 500 is trading at record highs, closing at a new peak of 7,126.06 on April 17, with an intraday high of 7,147.52. The index surged 12% in 11 sessions, the fastest rally since 1928, driven by easing Middle East tensions.
To the average investor, this vertical climb feels like the "new normal." We have become a generation of Pavlovian dip-buyers, conditioned by the post-2020 era to believe that market trauma is merely a brief, profitable detour on the road to inevitable new highs. But this collective amnesia is dangerous. By focusing solely on the velocity of the current rally, we have fallen into the Recency Bias Trap, completely scrubbed of the historical memory of "The Lost Years."
The modern psyche is scarred by—and now dependent on—the V-shaped recovery. Whether it was the 2020 pandemic crash or the 2022 inflation pivot, the "recovery" phase has felt like a high-speed elevator. However, history suggests that the market’s "reset" button is often jammed.
Consider the peak of October 9, 2007. Investors who bought into that euphoria didn't just experience a drawdown; they experienced a disappearance. It took 1,997 days—over five and a half years—just to get back to even. If you were a contrarian in 2007, you weren't fighting a price drop; you were fighting a half-decade of stagnation that burned out even the most disciplined bulls.
We are currently operating in a Duration Deficit. The market has been above its 50-day and 200-day moving averages since April 2026, creating a false sense of permanent support. When the trend eventually snaps—as it did in 2007—the crowd expects a bounce in weeks. They are fundamentally unprepared for a market that refuses to reward them for months, or even years.
The Arithmetic of Ruin: When "Buy the Dip" Becomes "Hold the Bag"
The modern investor has been conditioned by a decade of central bank interventions to view a 10% drawdown as a "discount" and a 20% drop as a "generational buying opportunity." But this perspective is born of a period characterized by instant gratification. When we look at the structural history of the S&P 500, we find that the true danger isn't the depth of the fall—it’s the duration of the recovery.
The 100% Hill
Most investors fundamentally misunderstand the physics of a market crash. Mathematically, the further you fall, the steeper the climb back to daylight. If you lose 10%, you need an 11% gain to break even. If you lose 20%, you need 25%.
However, as we saw during the Global Financial Crisis, a 57% drawdown requires a 132% rally just to return to your starting point. When you are sitting at the record highs of the "7,000 era," the margin for error is razor-thin. A "standard" correction in a cap-weighted index can quickly turn into an uphill battle that takes years of compounding just to erase.
The "Boredom Capitulation"
Wall Street loves to talk about "Panic Selling," but for the contrarian, the more interesting phenomenon is "Boredom Capitulation." In the 2007–2013 cycle, the market didn't just crash; it stayed stagnant. It took over five years to see a new high. During that window, the "Buy the Dip" crowd didn't exit because of a sudden crash; they exited because they watched their capital sit stagnant while inflation eroded their purchasing power.
Breaking even after five years is a mathematical illusion. If inflation averages 3–4% during a half-decade of sideways trading, your "break-even" is actually a 15–20% loss in real-world terms.
While you are "holding the bag" waiting for the S&P 500 to return to its previous peak, you are missing out on the rotation into value, commodities, or emerging markets that typically thrive when mega-cap indices stall.
Holding the Bag at the Peak
Today, with the S&P 500 stretched far above its 200-day moving average, the risk of becoming an "accidental long-term investor" is at a multi-year high. "Buying the dip" works wonders in a trending market, but it is a catastrophic strategy in a mean-reverting one.
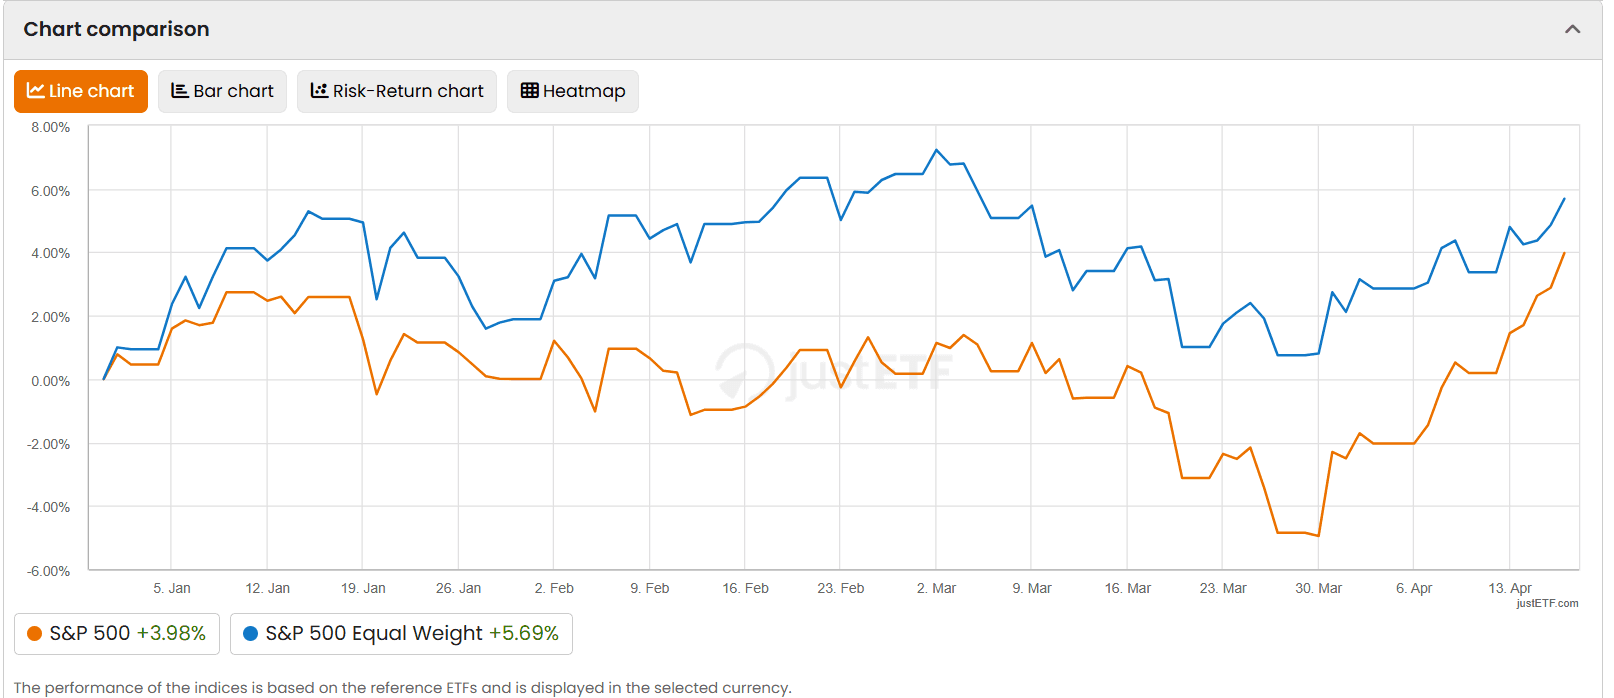
When the leadership of the market shifts—as evidenced by the Equal Weight Index beginning to outpace the market-cap giants—the old "winners" don't just bounce back. They become anchors.
If you’re buying the current surge because you fear missing out on the move to 7,500, ask yourself: are you prepared to hold that same position until 2031 just to see the color green again?
Why 2026 is More Like 2007 than 2022
The danger of the current "7,000 era" isn't just the height of the mountain, but the thinning oxygen of the ascent. Investors have become conditioned by the 2020 and 2022 corrections to expect a "V-shaped" rescue—a world where the central banks or a sudden tech breakthrough provides an immediate floor. But the structural data suggests that 2026 is mimicking the exhaustion of 2007 rather than the frantic reset of 2022.
The Exhaustion of the "Generals"
In 2022, the market fell in unison as interest rates spiked; it was a mechanical repricing. Today, we are seeing a much more ominous signal: divergence. While the S&P 500 hits record highs, the outperformance of the Equal Weight Index (up 6.1%) over the standard Market Cap Index (up 4.1%) suggests that the "Generals"—the mega-cap titans that have carried this bull market for a decade—are finally gasping for air.
In 2007, we saw similar internal crumbling. The headline numbers looked healthy, but under the surface, the leadership was Narrowing. When the biggest pillars finally buckle, they don't just "dip"; they create a vacuum. A market led by the "Average Stock" (Equal Weight) while the giants stall is a market transitioning from a growth phase to a distribution phase.
The 200-Day Gravitational Pull
For nearly a year, the index has defied gravity, staying perched above both its 50-day and 200-day moving averages. In the 2022 crash, the index frequently "tested" these levels, providing healthy resets. In 2026, we have seen a relentless linear climb with no meaningful touchpoints.
This creates a Technical Cliff. The further price drifts from its 200-day moving average, the more violent the eventual "mean reversion" becomes. In 2007, the initial break of the 200-day moving average wasn't a one-day event; it was the start of a multi-year grind. We are currently "stretched" to a degree that makes a quick V-shaped recovery mathematically improbable because there is no nearby structural support to catch the falling knife.
The Death of the "Fed Put" Illusion
In 2022, investors knew exactly what the enemy was: inflation and the Fed. Once those stabilized, the path was clear. 2026 is different. We are facing a "Cycle Maturity" problem. The surge to 7,000 hasn't been driven by a sudden explosion in earnings, but by multiple expansion and momentum.
Contrarians should recognize this as the "Late Cycle Melt-up." In 2007, the market ignored the cracks in the subprime foundation because the price action was too seductive to quit. Today, the "crack" is the extreme concentration of passive indexing. When the flow of passive capital finally reverses, there won't be a "V-shape" recovery because there will be no one left to buy the first 10% drop. We aren't looking at a quick shock to the system; we are looking at the potential for a long, slow-motion exit where the next "all-time high" becomes a distant memory of the mid-2020s.
The Strategy for a Stagnant Decade: The TQQQ-SPY Midday Reversal
If history is our guide, the "buy and hold" crowd is about to enter a period of profound frustration. When the broad market indices grind sideways for years—as they did from 2007 to 2013—the traditional "set it and forget it" mentality doesn't just stall; it decays. To beat a market that refuses to move upward, you must stop betting on direction and start capturing volatility.
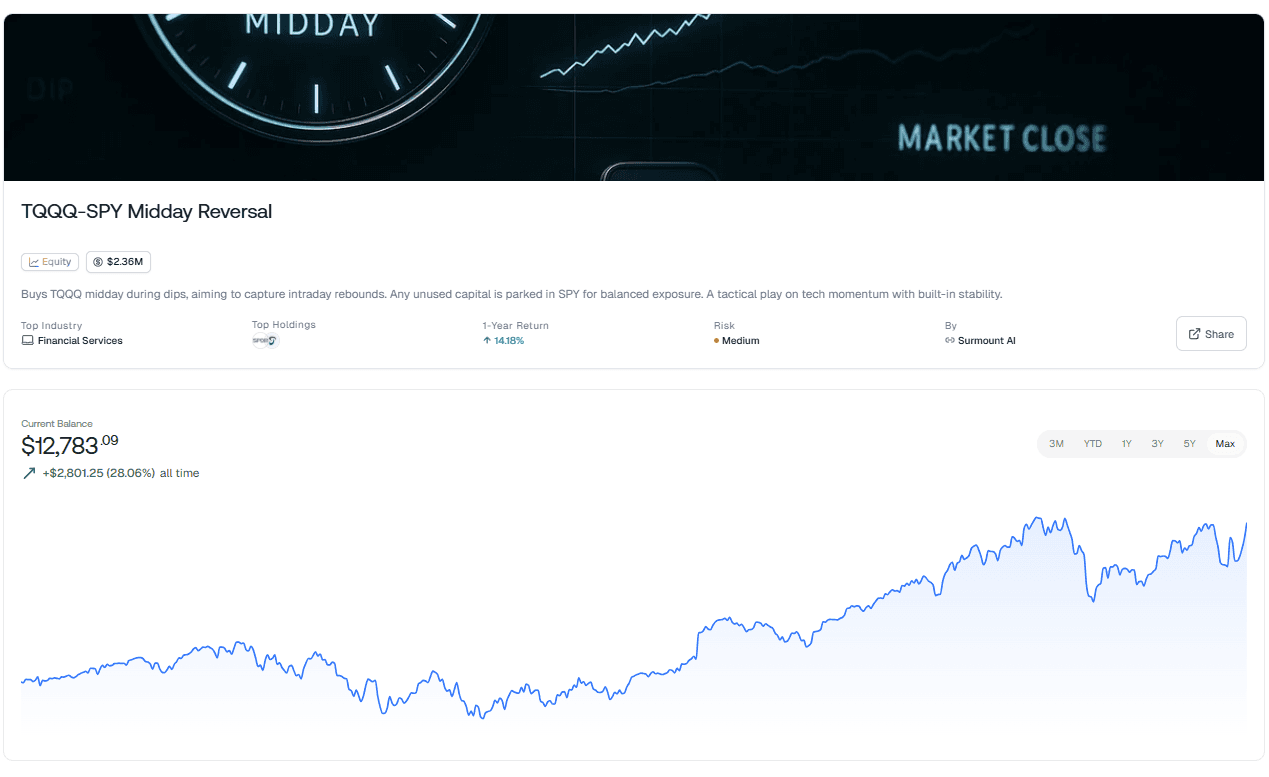
We’ve found a tactical answer to the "Duration Myth" on Surmount: the TQQQ-SPY Midday Reversal strategy.
Why This Wins When Indexing Fails
While the S&P 500 may take years to reclaim new highs, the intraday "heartbeat" of the market never stops. This automated strategy is designed to exploit the specific technical behavior of tech momentum during high-uncertainty regimes:
The Tactical Dip-Buy: The strategy identifies intraday "washouts" in the Nasdaq-100. By buying TQQQ midday during these dips, it captures the high-probability "mean reversion" rebounds that happen before the closing bell—regardless of whether the primary trend is bullish or bearish.
The Midnight Exit: By selling TQQQ by the end of the day, you eliminate "gap-down" risk and overnight exposure—the very thing that destroys portfolios during long-term drawdowns.
The Stability Anchor: Any capital not actively deployed in the midday reversal is parked in SPY. This ensures you maintain a baseline exposure to the 500 largest U.S. companies, providing a balanced foundation while your "active" capital hunts for alpha.
Maximize Your Recovery, Minimize Your Wait
Don't be the investor waiting five years for a "break-even" notification. The TQQQ-SPY Midday Reversal allows you to stay liquid, stay tactical, and extract value from the market’s daily oscillations while others are paralyzed by the "long grind."
[Deploy the TQQQ-SPY Midday Reversal on Surmount Today]
Take control of the clock. Because in a market that goes nowhere, movement is everything.
NEVER MISS A THING!
Subscribe and get freshly baked articles. Join the community!
Join the newsletter to receive the latest updates in your inbox.
Related post

April 14, 2026

March 17, 2026
